Page 39 - Ickford NP Background Evidence
P. 39

ICKFORD NEIGHBOURHOOD PLAN : BACKGROUND EVIDENCE REPORT  39
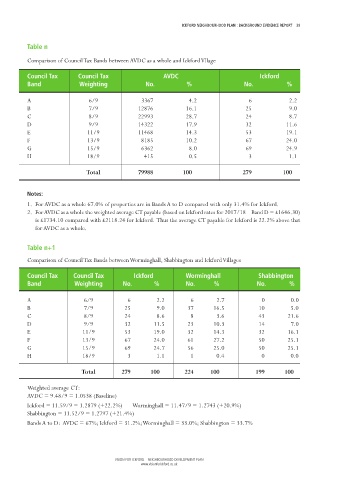


           Table n
           Comparison of Council Tax Bands between AVDC as a whole and Ickford Vllage


           Council Tax      Council Tax                   AVDC                              Ickford
           Band              Weighting              No.           %                    No.            %

           A                    6/9                3367            4.2                   6             2.2
           B                    7/9               12876           16.1                 25              9.0
           C                    8/9               22993           28.7                 24             8.7
           D                    9/9               14322           17.9                 32            11.6
           E                    11/9             11468            14.3                 53            19.1
           F                    13/9               8185           10.2                 67            24.0
           G                    15/9               6362            8.0                 69            24.9
           H                    18/9                415            0.5                  3              1.1

                               Total              79988          100                  279           100


           Notes:
           1. For AVDC as a whole 67.0% of properties are in Bands A to D compared with only 31.4% for Ickford.
           2. For AVDC as a whole the weighted average CT payable (based on Ickford rates for 2017/18 – Band D = £1646.30)
             is £1734.10 compared with £2118.24 for Ickford.  Thus the average CT payable for Ickford is 22.2% above that
             for AVDC as a whole.


           Table n+1
           Comparison of Council Tax Bands between Worminghall, Shabbington and Ickford Villages


           Council Tax     Council Tax          Ickford           Worminghall               Shabbington
           Band            Weighting         No.        %         No.         %            No.          %

           A                  6/9              6        2.2         6        2.7              0         0.0
           B                  7/9            25         9.0        37       16.5            10         5.0
           C                  8/9            24         8.6         8        3.6             43       21.6
           D                  9/9            32        11.5        23       10.3            14          7.0
           E                  11/9           53        19.0        32       14.3            32        16.1
           F                  13/9           67        24.0        61       27.2            50        25.1
           G                  15/9           69        24.7        56       25.0            50        25.1
           H                  18/9            3         1.1         1        0.4             0         0.0


                              Total         279       100         224      100             199       100

           Weighted average CT:
           AVDC = 9.48/9 = 1.0538 (Baseline)
           Ickford = 11.59/9 = 1.2879 (+22.2%)  Worminghall = 11.47/9 = 1.2743 (+20.9%)
           Shabbington = 11.52/9 = 1.2797 (+21.4%)
           Bands A to D:  AVDC = 67%; Ickford = 31.2%; Worminghall = 33.0%; Shabbington = 33.7%


                                         VISION FOR ICKFORD – NEIGHBOURHOOD DEVELOPMENT PLAN
                                                   www.visionforickford.co.uk
   34   35   36   37   38   39   40